Automated testing
Use automated tools to find common accessibility barriers.
Automated testing is a quick way to find accessibility barriers. However, no tool can find all issues.
You should run automated tools whenever you test your website. For example, during development when implementing a new feature, or as part of a detailed accessibility audit with an expert auditor.
You do not need technical expertise to run the tests, but you may do to interpret the results and prioritise the issues.
If you're not sure which pages to test, refer to Preparing for an accessibility audit.
Tools to use
Automated tools cannot find all accessibility issues. It's best to use a mixture of tools as they will find different things. Some of the tools we use include:
- Google Lighthouse
- Axe
- WAVE
How to run the tests
Document results as you go, noting any failures. Do this in the same spreadsheet you use to record your manual testing. Use the following instructions to run the tests.
Google Lighthouse
1. Open Chrome DevTools
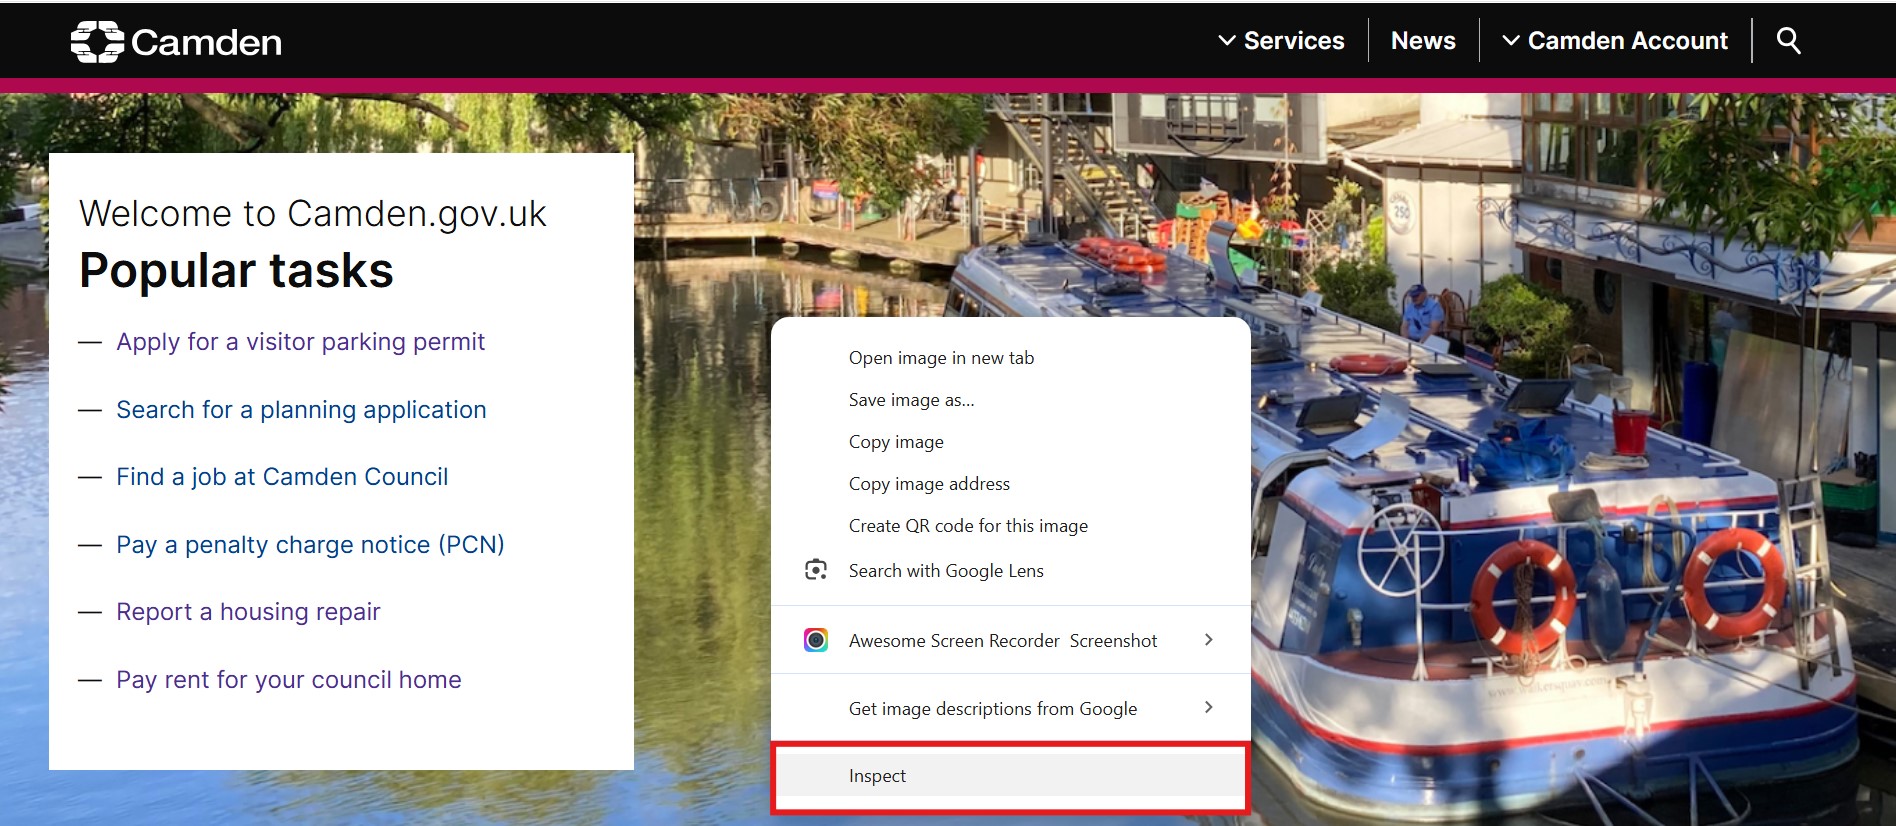
Go to the page you want to test in Google Chrome. Open Chrome DevTools by right-clicking on the page and selecting 'Inspect.' You can also press Ctrl+Shift+I (Windows) or Cmd+Option+I (Mac).
2. Run Lighthouse
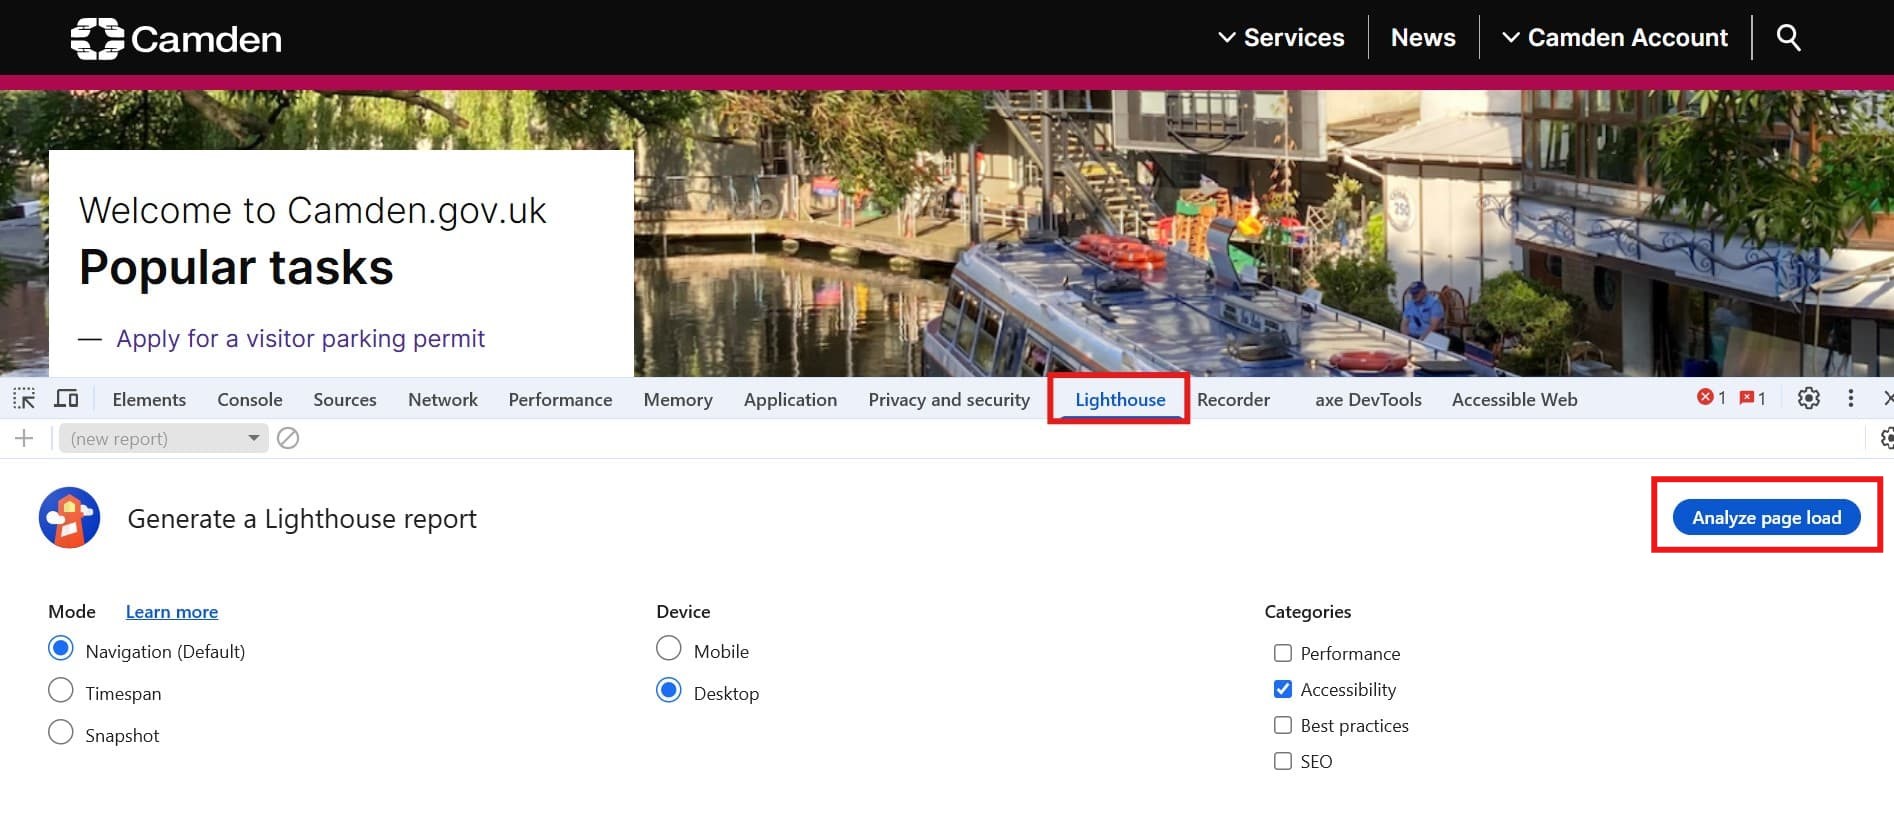
In the now-opened DevTools panel, select the 'Lighthouse' tab. Choose whether to test on mobile or desktop, and check only the 'Accessibility' option from the categories column. Select 'Analyze page load'.
3. View and save the report
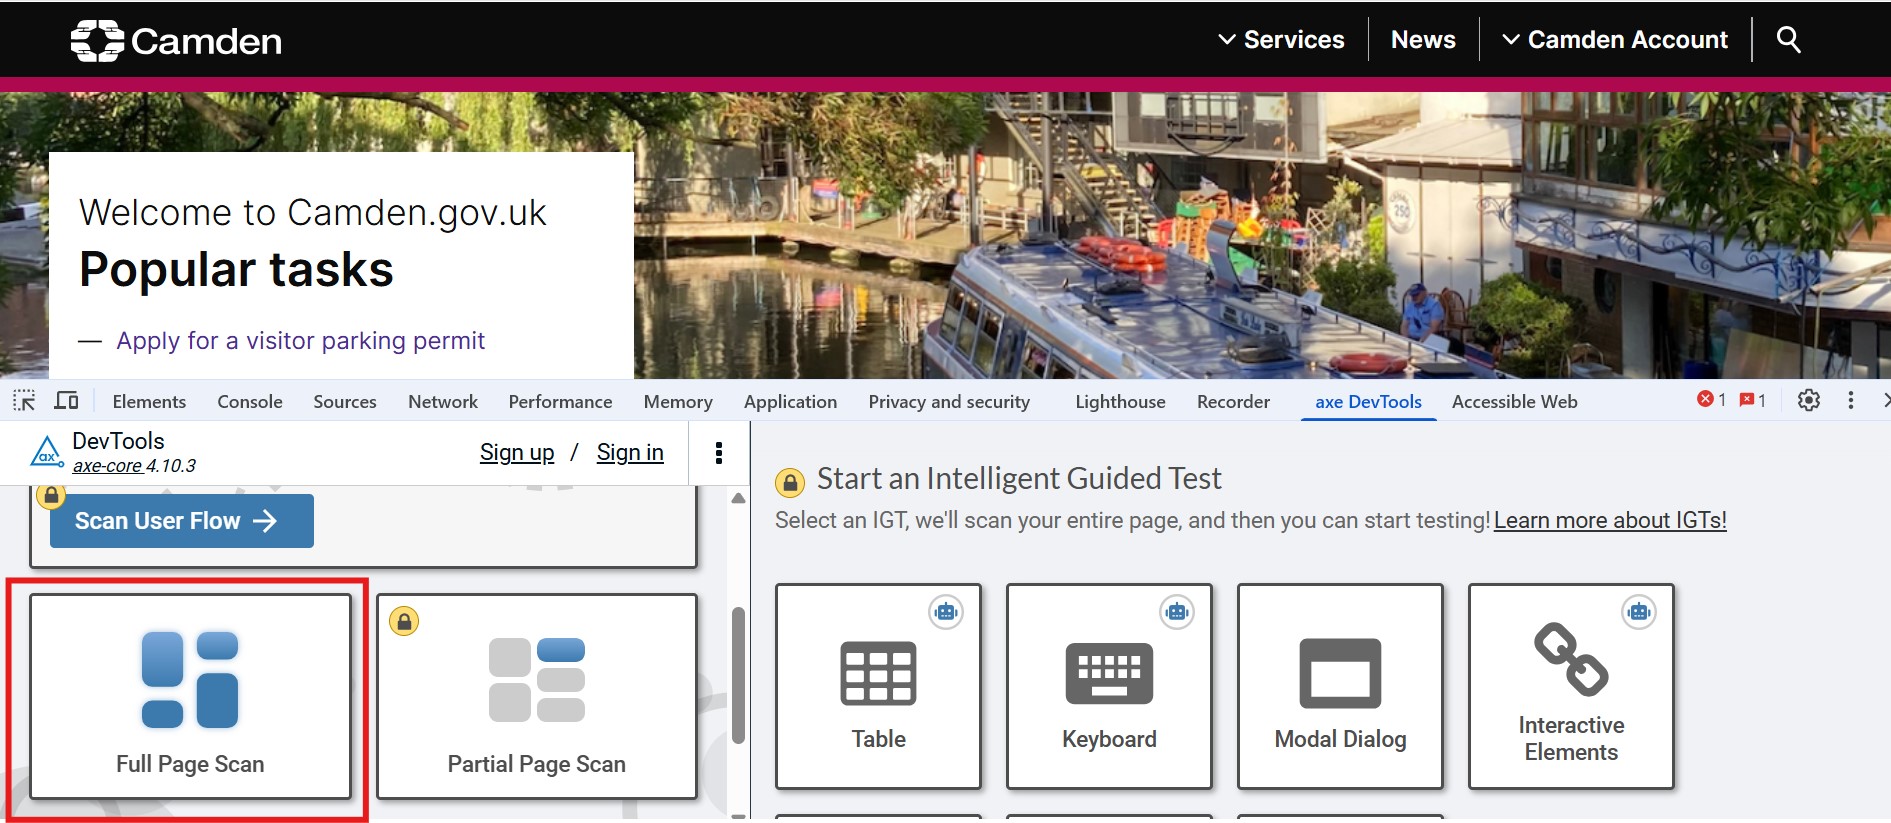
Open the three dots menu and select 'Print Expanded' for the option to save the full report as a PDF. You can read the report now and you should save a copy to refer to later.
Axe
To test with Axe in your browser:
1. Install Axe DevTools
Install a free Axe DevTools browser extension.
2. Open Axe DevTools
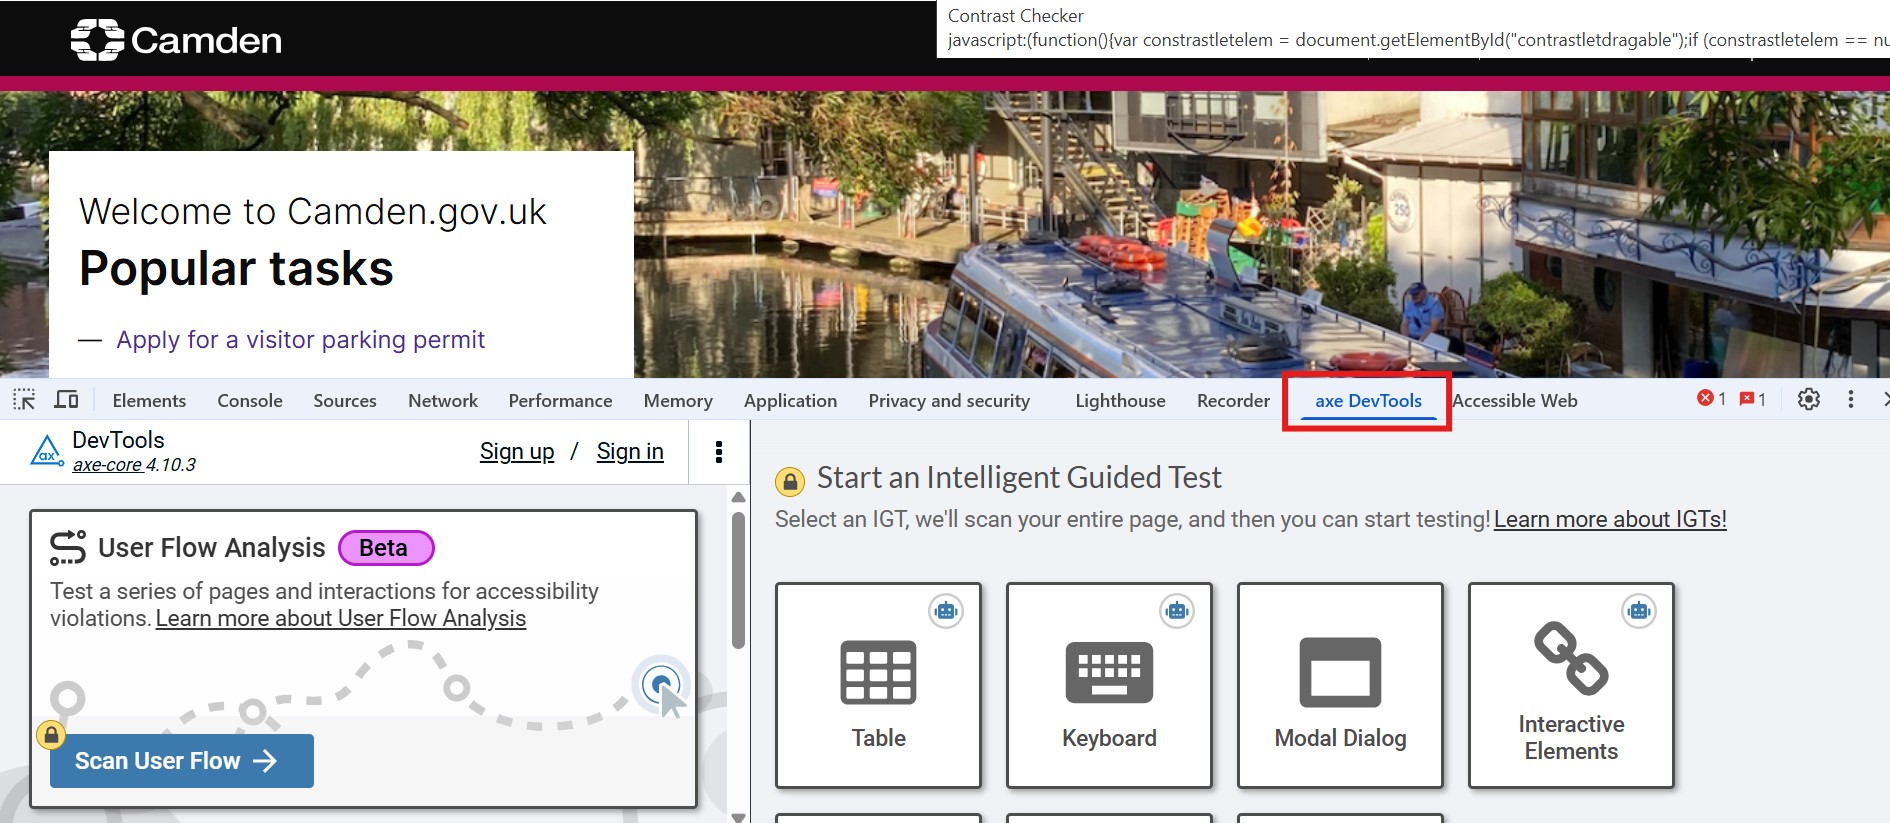
Go to the page you want to test and open Axe DevTools by right-clicking on the page and selecting 'Inspect.' You can also press Ctrl+Shift+I (Windows) or Cmd+Option+I (Mac). Select the 'Axe DevTools' tab.
3. Run Axe DevTools
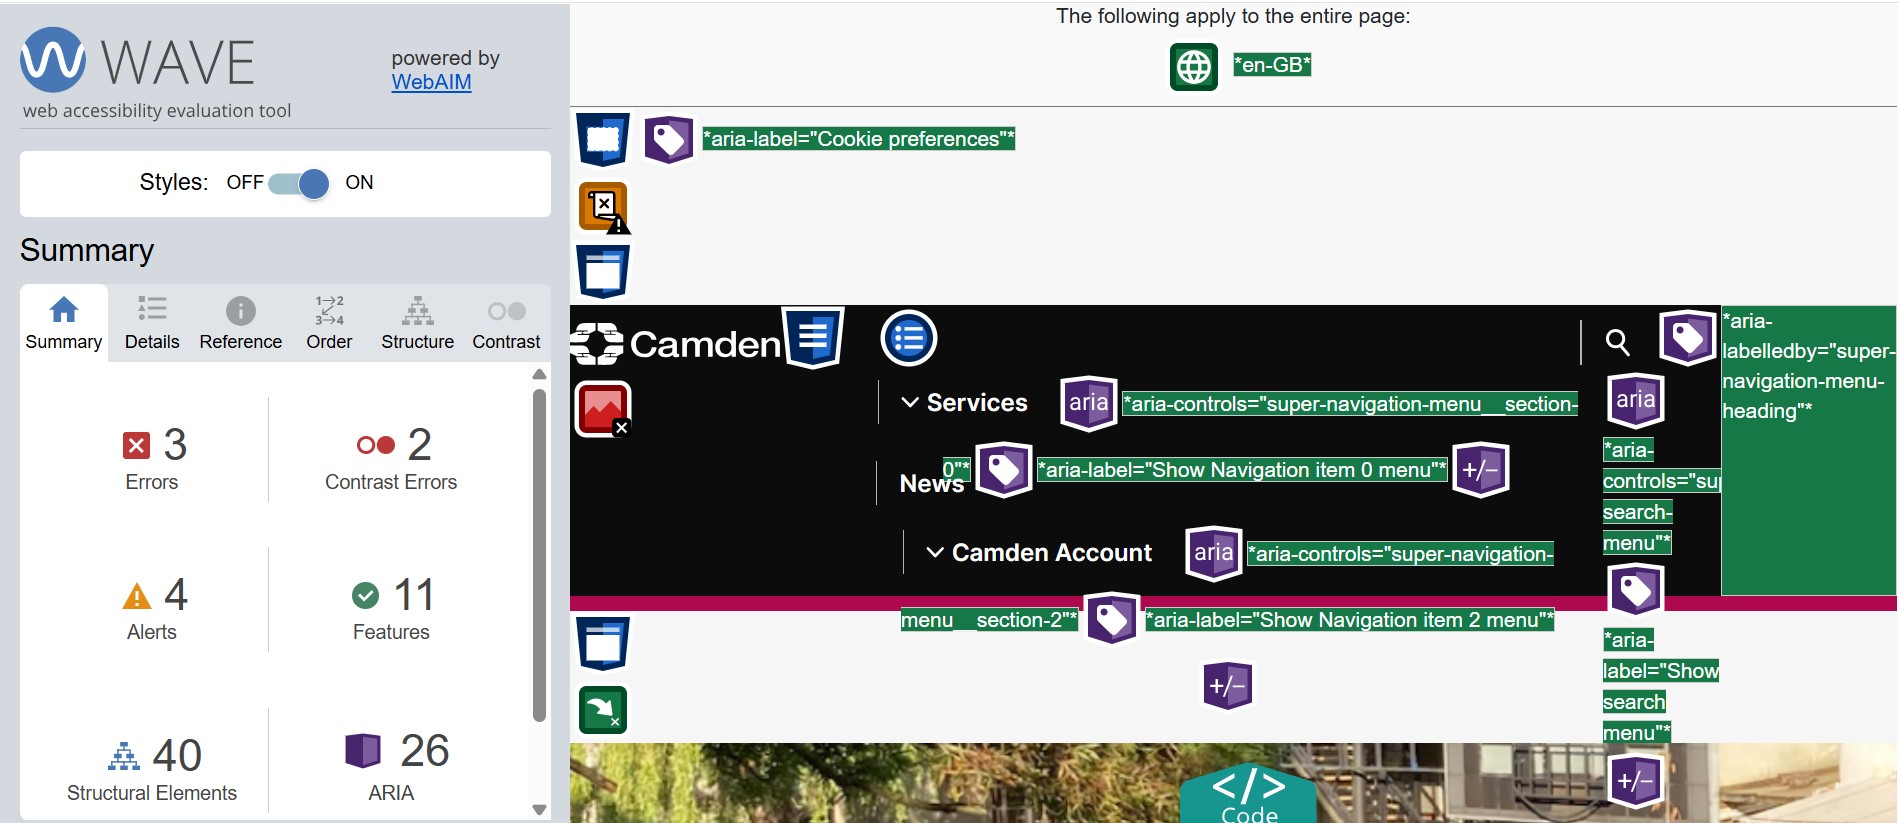
Use the left-hand scrollbar to find and select the 'Full page scan' option.
It will take a few moments to analyse your page and the issues will be listed in the right-hand panel. If you are a developer who wants to run Axe locally, install and run axe-core in your application.
WAVE
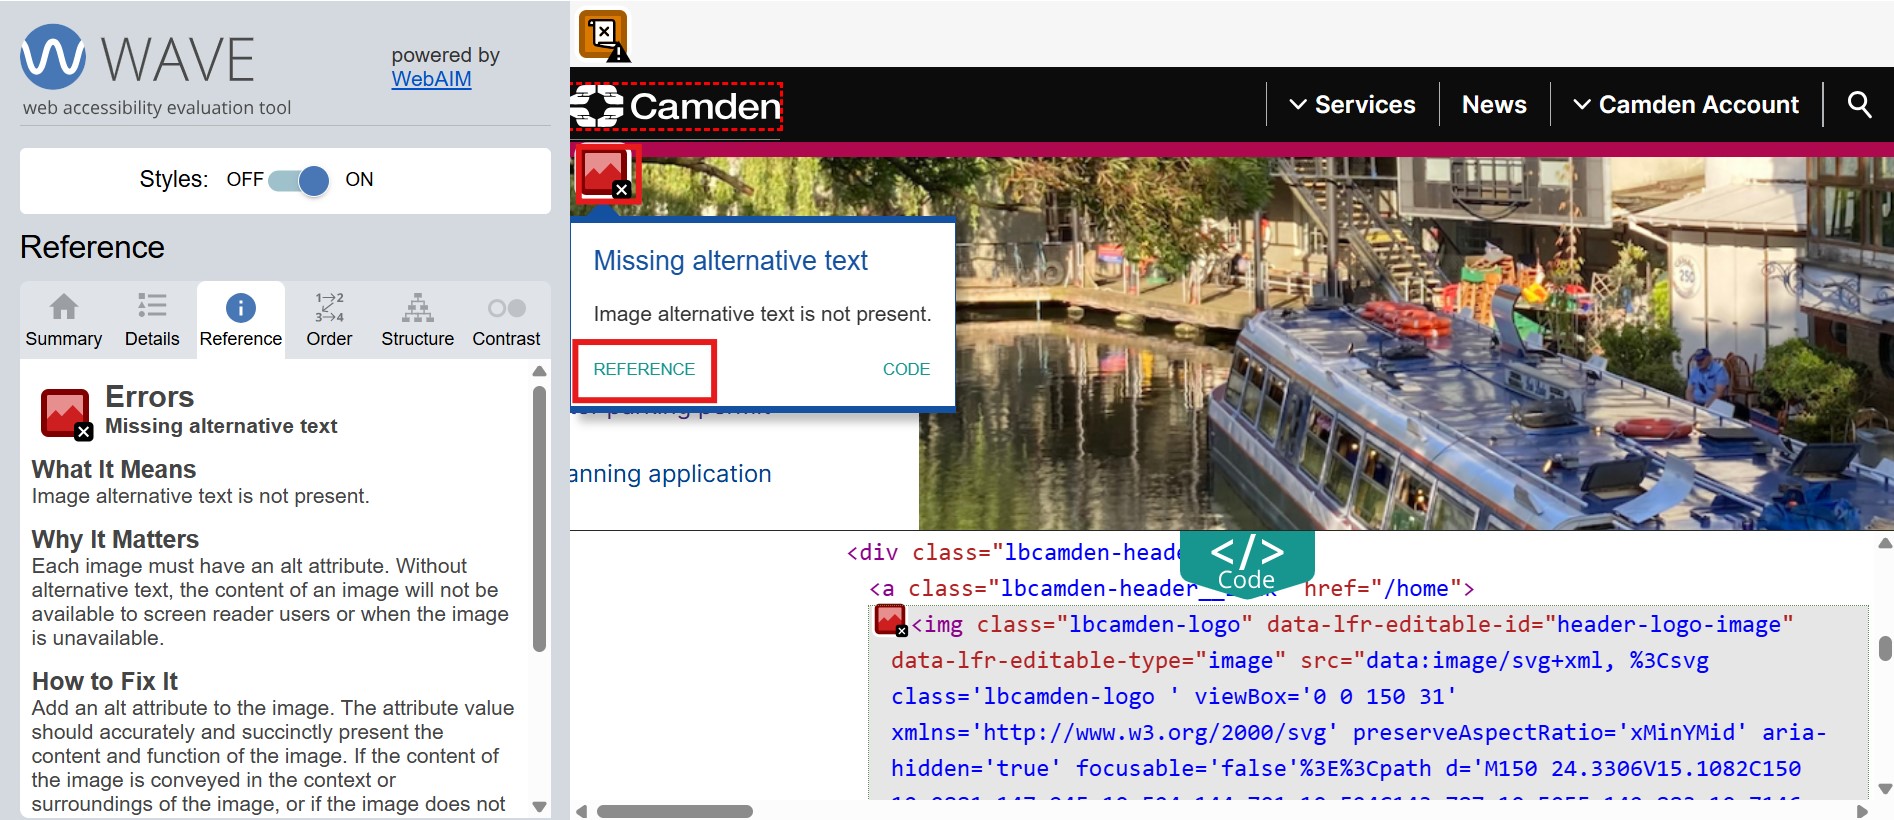
Install the WAVE extension for your chosen browser. To test with WAVE, run the browser extension and wait for the tool to analyse your page. You should now see an overlay on the page content:
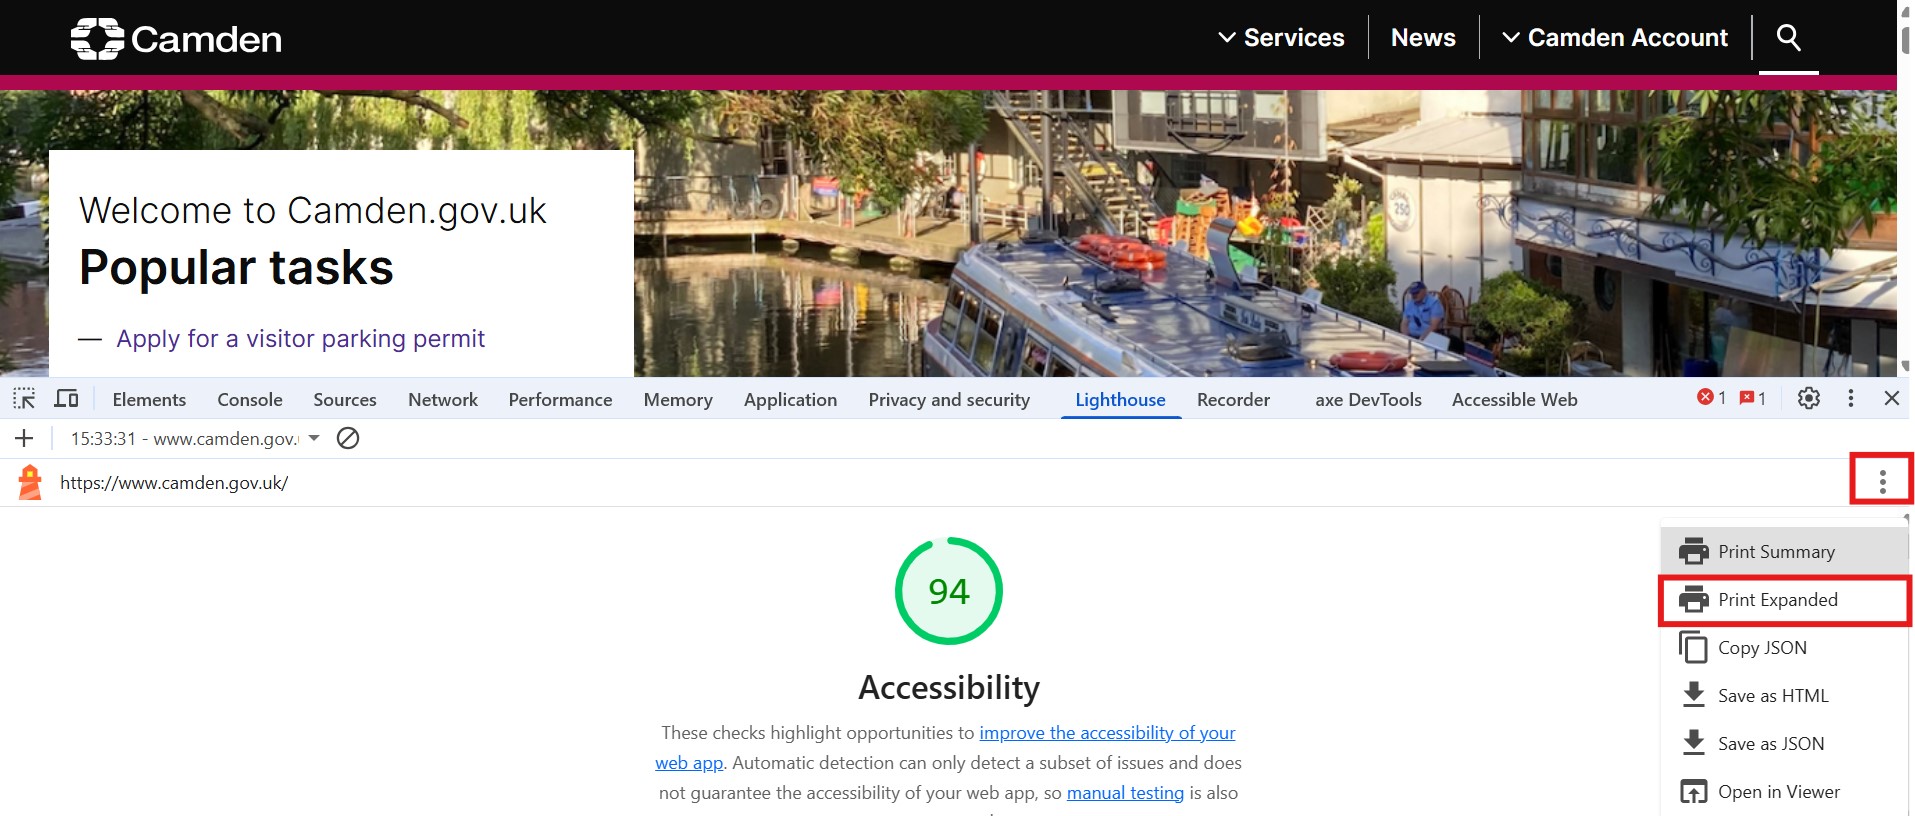
There are 3 main types of issues to check:
- contrast errors, which relates to colour contrast issues
- errors, which are any other errors the tool has decided are definitely an issue
- alerts, which the tool could not decide are definitely issues so need a manual check
To view these in detail, select the 'Details' tab in the left-hand panel.
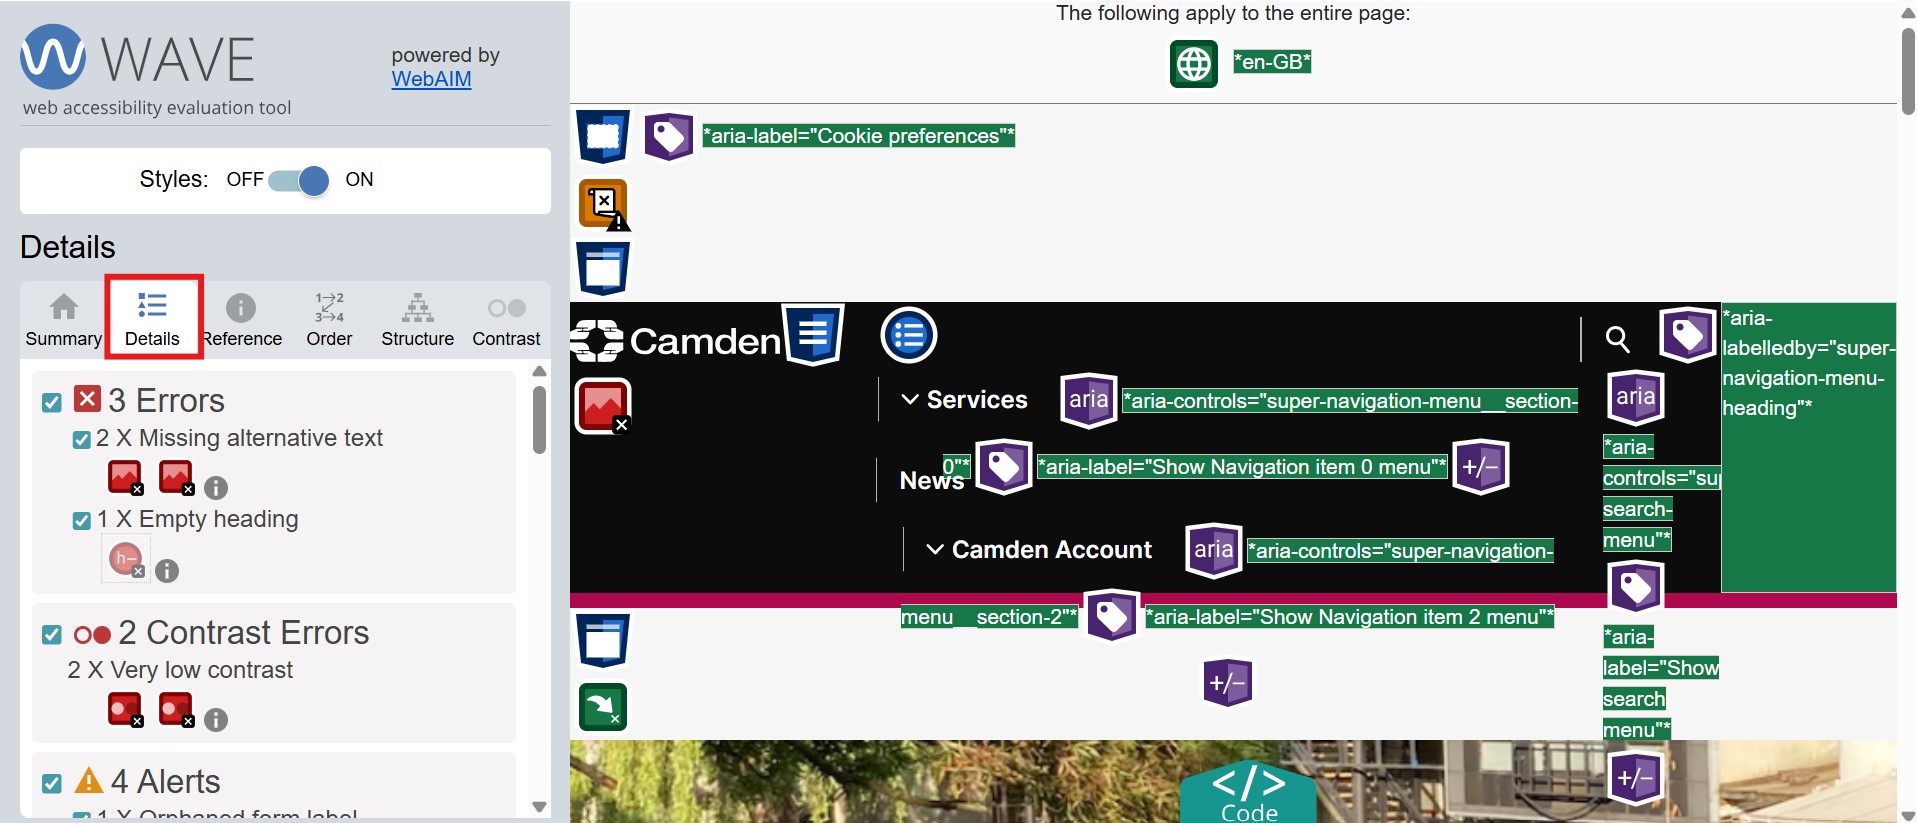
WAVE also captures information about page structure and accessibility features. Unchecking everything except the errors and alerts will make it easier to see the issues on the page.
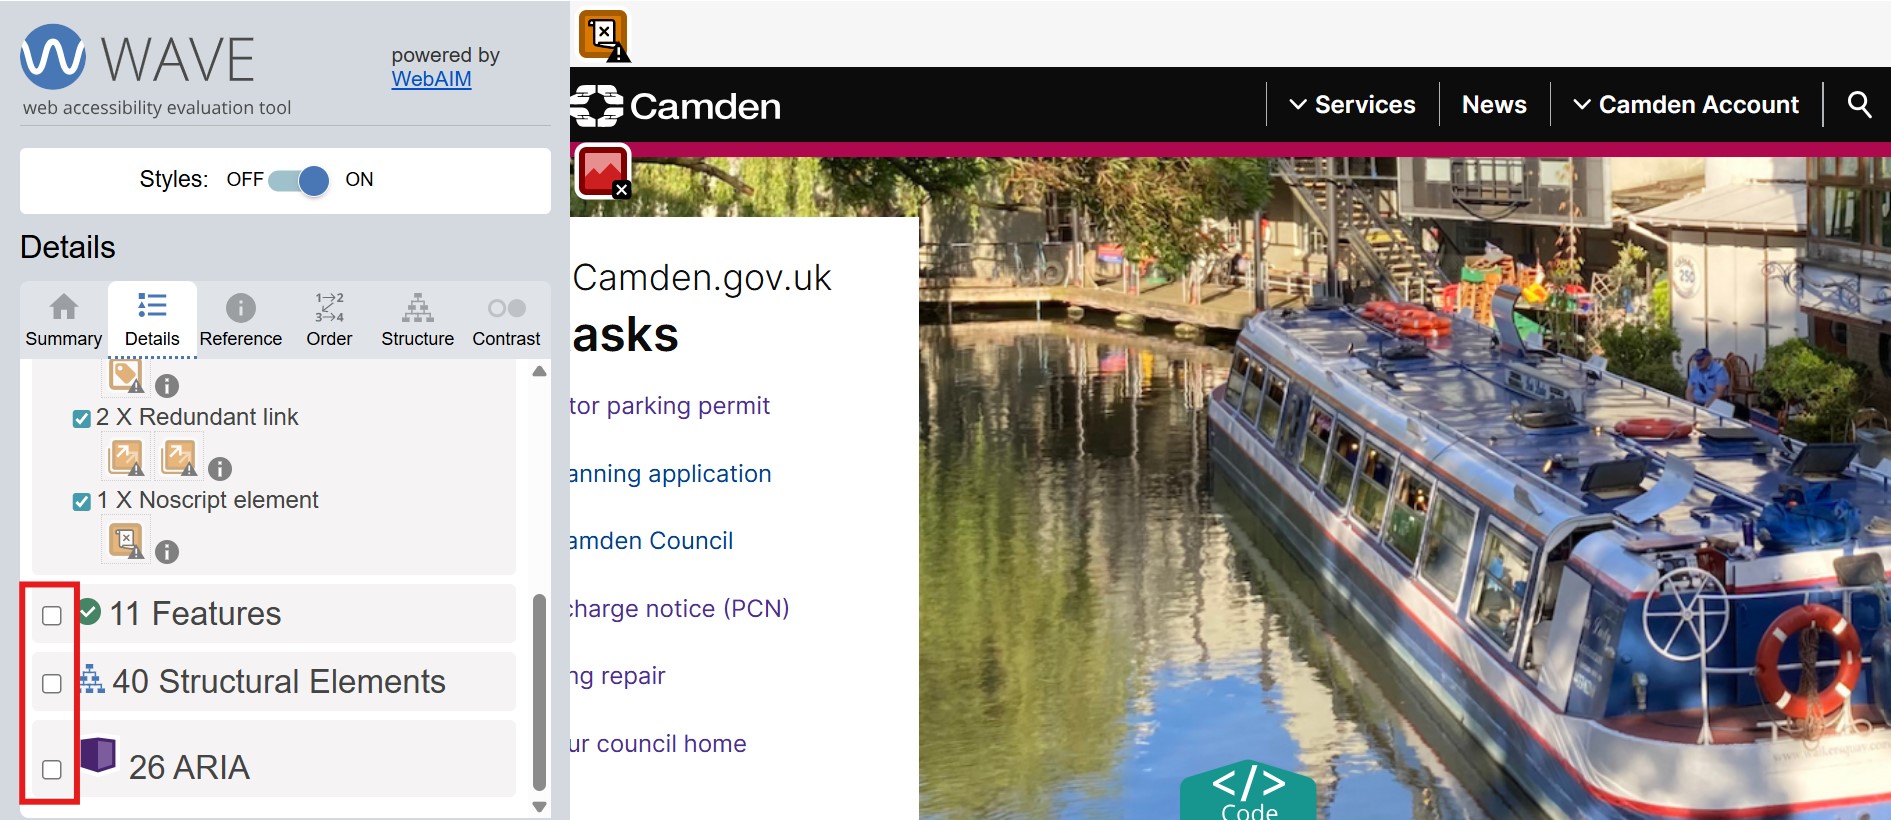
Select the icons on the page for more details about each issue. Then select 'reference' to read why it matters and how to fix it.